The Relation between Accessibility and Economic Development, 2006
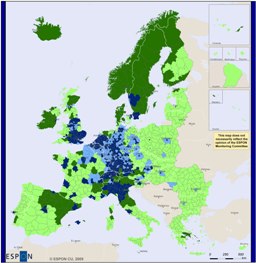
 The Territorial Agenda of the European Union states that “Mobility and accessibility are key prerequisites for economic development of all regions of the EU.” In practice this means that regions having a high accessibility to raw materials, suppliers and markets are in general economically successful regions and improve their competitive position in the global market. If so, transport infrastructure improvement might be an important policy instrument to promote regional economic development. Therefore it is highly policy-relevant to know if regions with high accessibility are at the same time economic successful regions. To understand this, ESPON compared the potential multimodal accessibility of regions in 2006 with GDP-PPS per capita in 2006.
Concept/method/measurement
Potential accessibility is calculated based on two elements: population in NUTS 3 regions and the effort (time, distance) to reach them. The accessibility model used by ESPON (1) measures the minimum travel time between all NUTS 3 regions. In this case, multimodal accessibility integrates the accessibility by road, rail and air into one indicator expressing the combined effect of these modes for each NUTS 3 region. In summary, potential accessibility describes how easy people in one region can reach people located in other European regions.
As indicator for economic success the GDP-PPS per capita is used. GDP-PPS is the gross domestic product (GDP) per power purchasing standard (PPS) where PPS takes into account the relative cost of living and inflation rates. This makes it possible to compare the indicator between countries. This indicator is then divided by the total population in the region (NUTS 3).
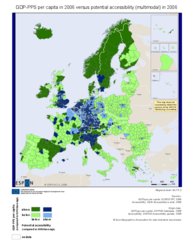
In order to compare potential accessibility with GDP-PPS per capita both components are divided into two classes of above and below ESPON average. The map now clearly shows on the one hand the dark and light coloured regions indicating the regions that have a GDP-PPS per capita above respectively below average. On the other hand the greenish and bluish colours in the map clearly indicate the regions that have a potential accessibility below respectively above ESPON average.
Three key findings
The relation between Accessibility and Economic Development displayed in 2006 the pattern in the map. In relation to potential accessibility and GDP 69% of the regions are in a double positive or double negative situation, i.e. they have GDP and accessibility both above respectively below ESPON average, which argues a significant link between Accessibility and Economic Development. Three key findings can be drawn:
(1) Almost 1/3 of the regions revealed to have a high potential accessibility (dark blue). These regions are mainly located in the economic core of Europe, the so-called Pentagon. Remarkable is that most of the remaining regions in this area are regions with a GDP per capita lower than ESPON average but with a high potential accessibility (light blue). Most capital regions of Europe show the same pattern: a double positive situation in the capital surrounded by regions with a below average GDP per capita. These latter regions have some underused potential that they could investigate and exploit in order to increase their economic welfare. Moreover, they could also profit more easily from their neighbouring areas with high GDP due to their location and their high potential accessibility.
(2) More than 1/8 of the European regions have low accessibility and nevertheless a high GDP per capita (dark green). These regions can be found in the Nordic countries, North-East of Spain, Scotland, Ireland and in and around Northern Italy. Apparently, accessibility is not a determinant factor for the high regional economic performance of those regions. The question is how do these more sparsely populated regions create their economic welfare? The regions in the Nordic countries, for example, have overcome their peripheral allocation by exploiting ICT, research, educational and environmental opportunities and not so much by improving their physical accessibility.
(3) More than 1/3 of the regions of Europe have both accessibility and welfare below ESPON average (light green). These regions, predominantly found in peripheral areas in Eastern and Southern Europe, face a “double” challenging situation and would require particular attention in relation to the aim of territorial cohesion. Remedies to increase their economic welfare should however include more than only policies and measures to increase their accessibility. A package of measures should be commenced, measures that could explore a higher accessibility.
Conclusions
High accessible seems to be a prerequisite for a good economic development of regions. The map shows that 2/3 of the regions are double positive or double negative in relation to GDP and accessibility. And as such these regions are in line with the assumption that GDP is significantly linked to potential accessibility. However, 1/8 of the regions found other ways to overcome their low accessibility and nevertheless reached a more than average economic welfare. These regions can be found in the Northern periphery and particular regions in Northern Italy and Spain. Regions phasing a “double” challenging situation may learn from the remedies taken here to increase their economic development.
(1) Based on Spiekermann and Wegener, 1996.


